Performance benchmarking: beware frequency scaling!
I’ve been spending an unreasonable amount of time trying to understanding performance jitters in a C++ application I’m working on. I have been measuring the time taken to execute a physics update as part of a graphics loop, something like:
void update() {
    // Need to analyze performance of this function:
    step_physics();

    // Regular OpenGL drawing stuff, glBuffer etc
    draw();
}
I’m interested in optimizing the physics step, so I instrument it using std::chrono:
void update() {
    using namespace std::chrono;

    auto start = high_resolution_clock::now();
    step_physics();
    duration<double> elapsed = high_resolution_clock::now() - start;
    double physics_time = elapsed.count();

    // Regular OpenGL drawing stuff, glBuffer etc
    draw();
}
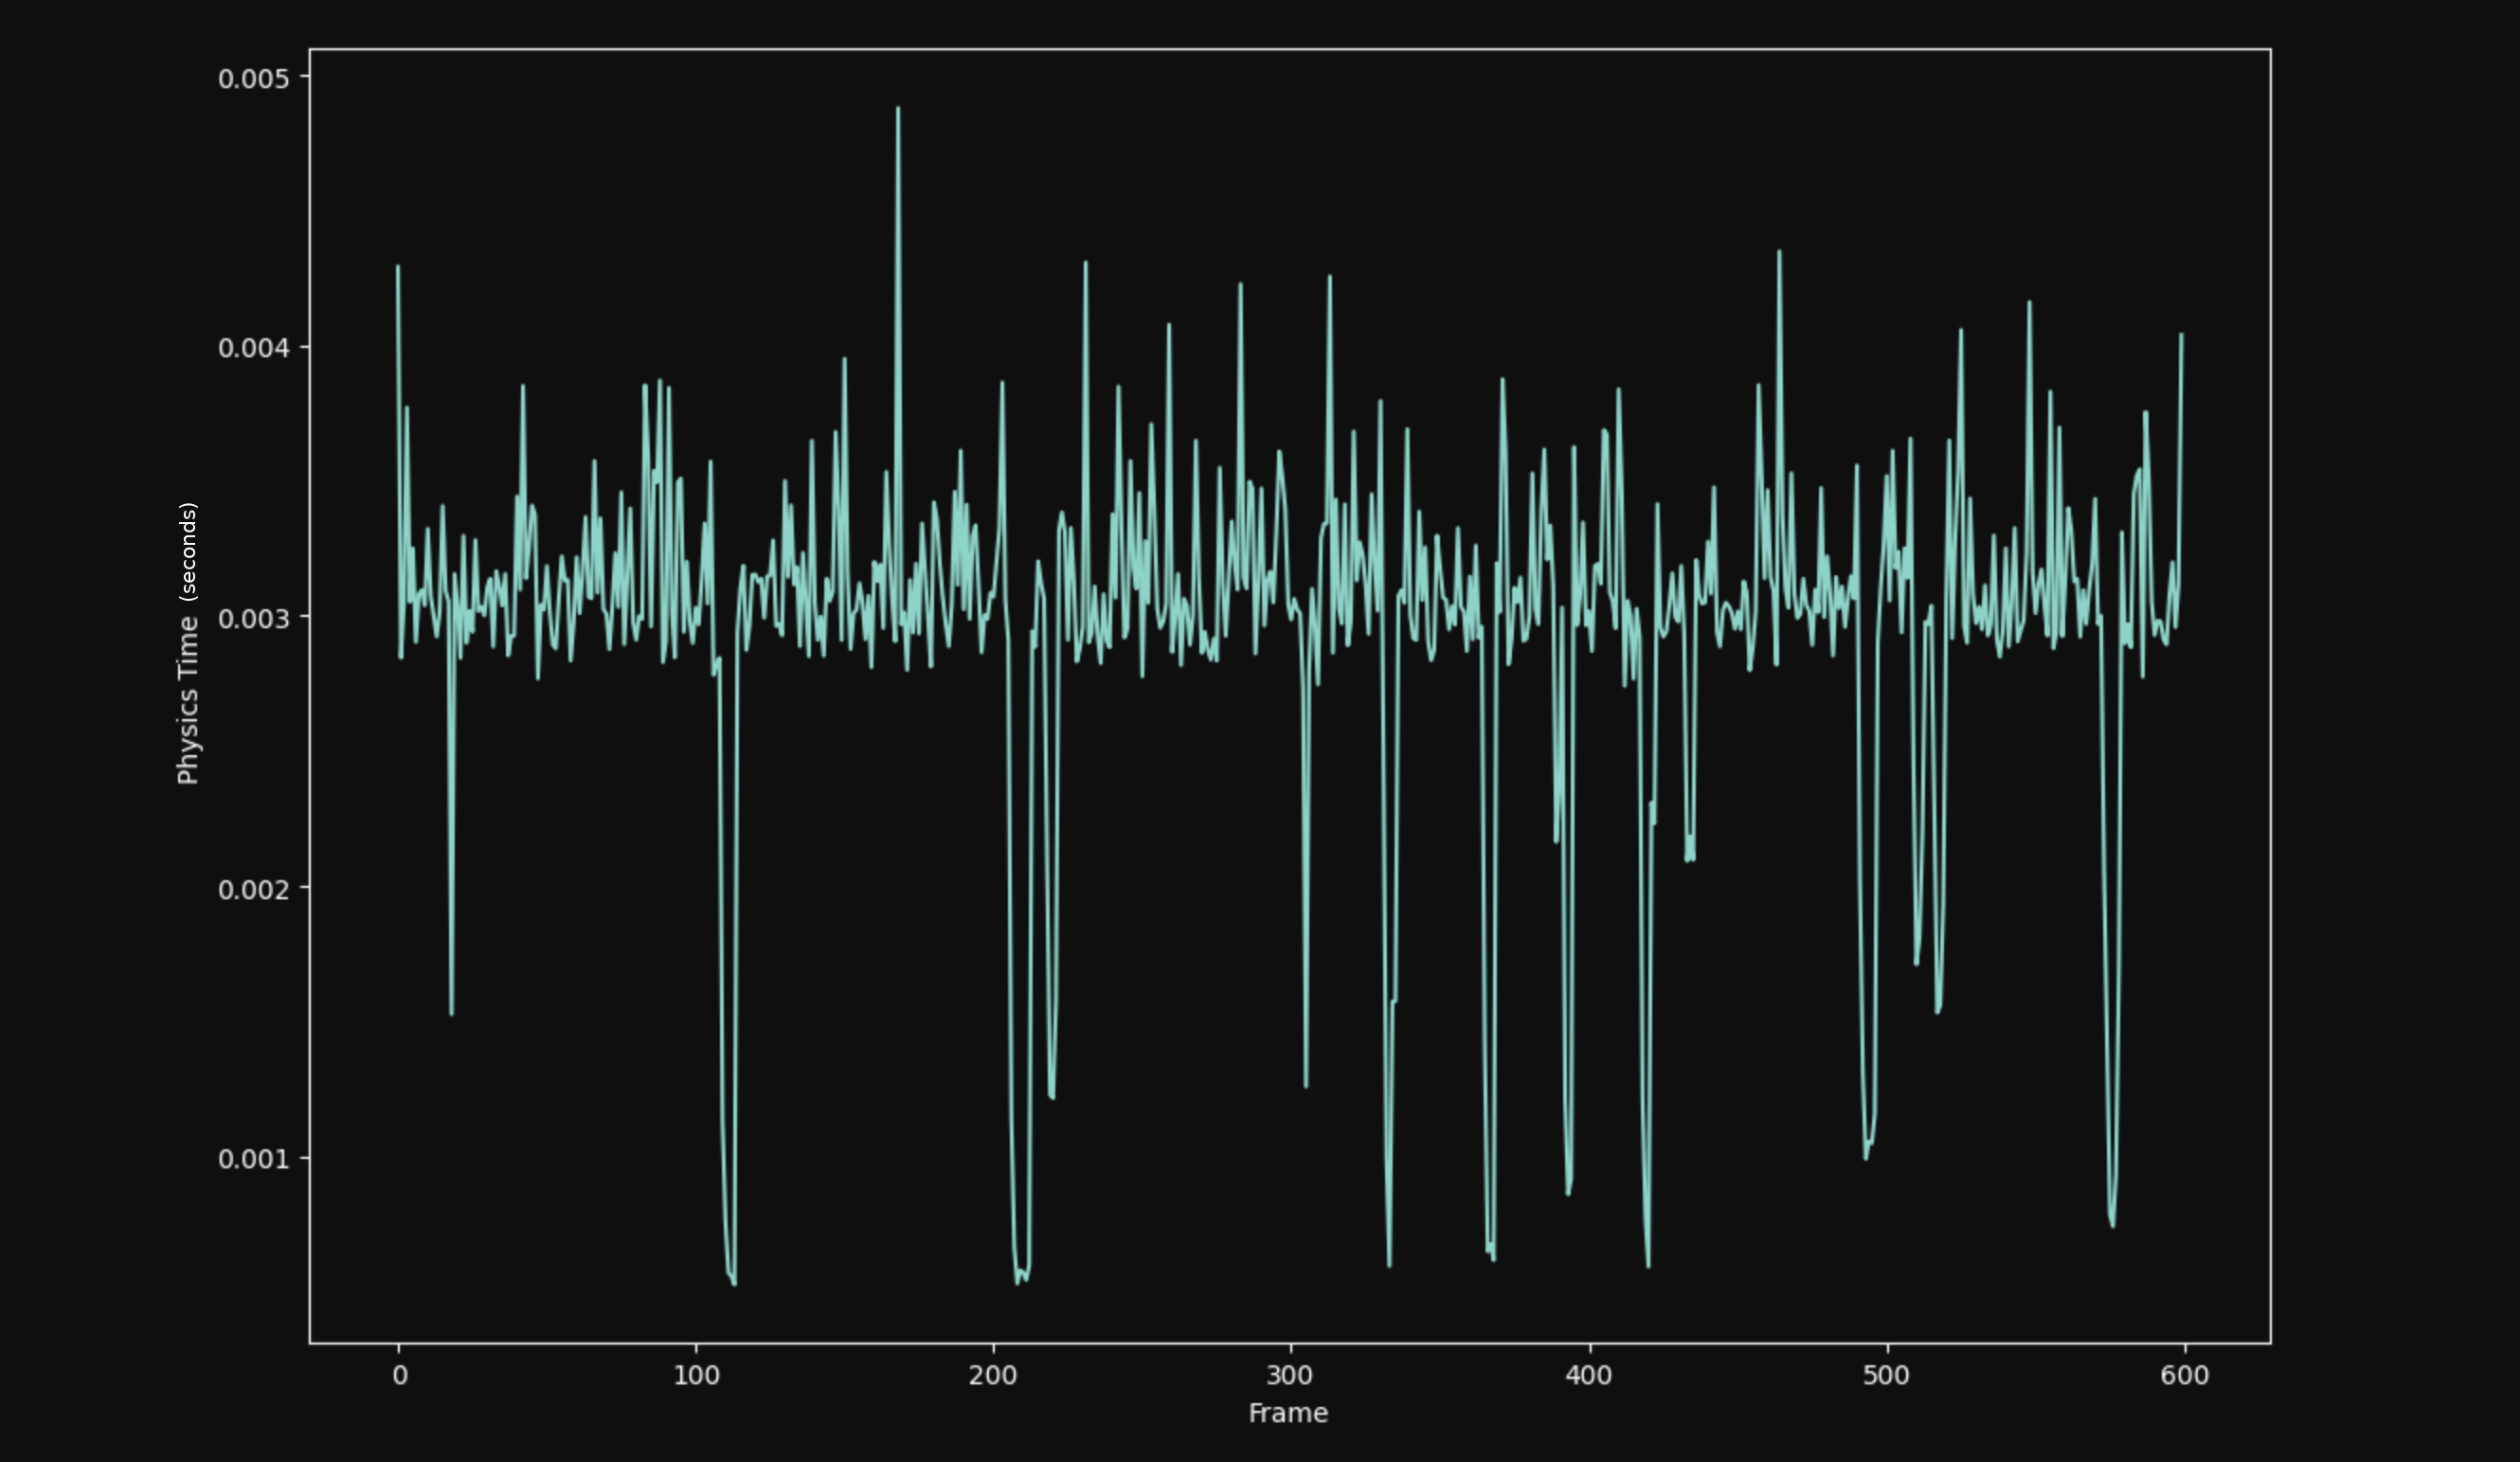
Here’s what time taken looks like:

That’s a terrifying amount of jitter! Many dead ends and experiments later, I noticed that the performance stabilized when I started drawing more things to understand the problem. Turns out, the jitters were a result of not doing enough work in the draw call!
Operating systems typically employ some form of CPU frequency scaling to save power when the system isn’t doing much work. The default governor on my system would keep the CPU at a low-power low-frequency mode, and dynamically increase it when the system load increases.
My application ran at 60FPS(about 16.67ms per frame). Since the update took much less than that overall, the process would sleep till the next frame. The default CPU governor powersave would keep the CPU at a lower frequency because it sees the process mostly sleeping! During the update function however, the frequency would be scaled. This caused massive fluctuations in the recorded benchmarks!
Also, I should note that this was a symptom of improper benchmarking: I knew that the performance was stable if I simply ran the physics updates and didn’t draw anything. :( This entire ordeal was an attempt to understand why drawing would cause such massive differences in performance!
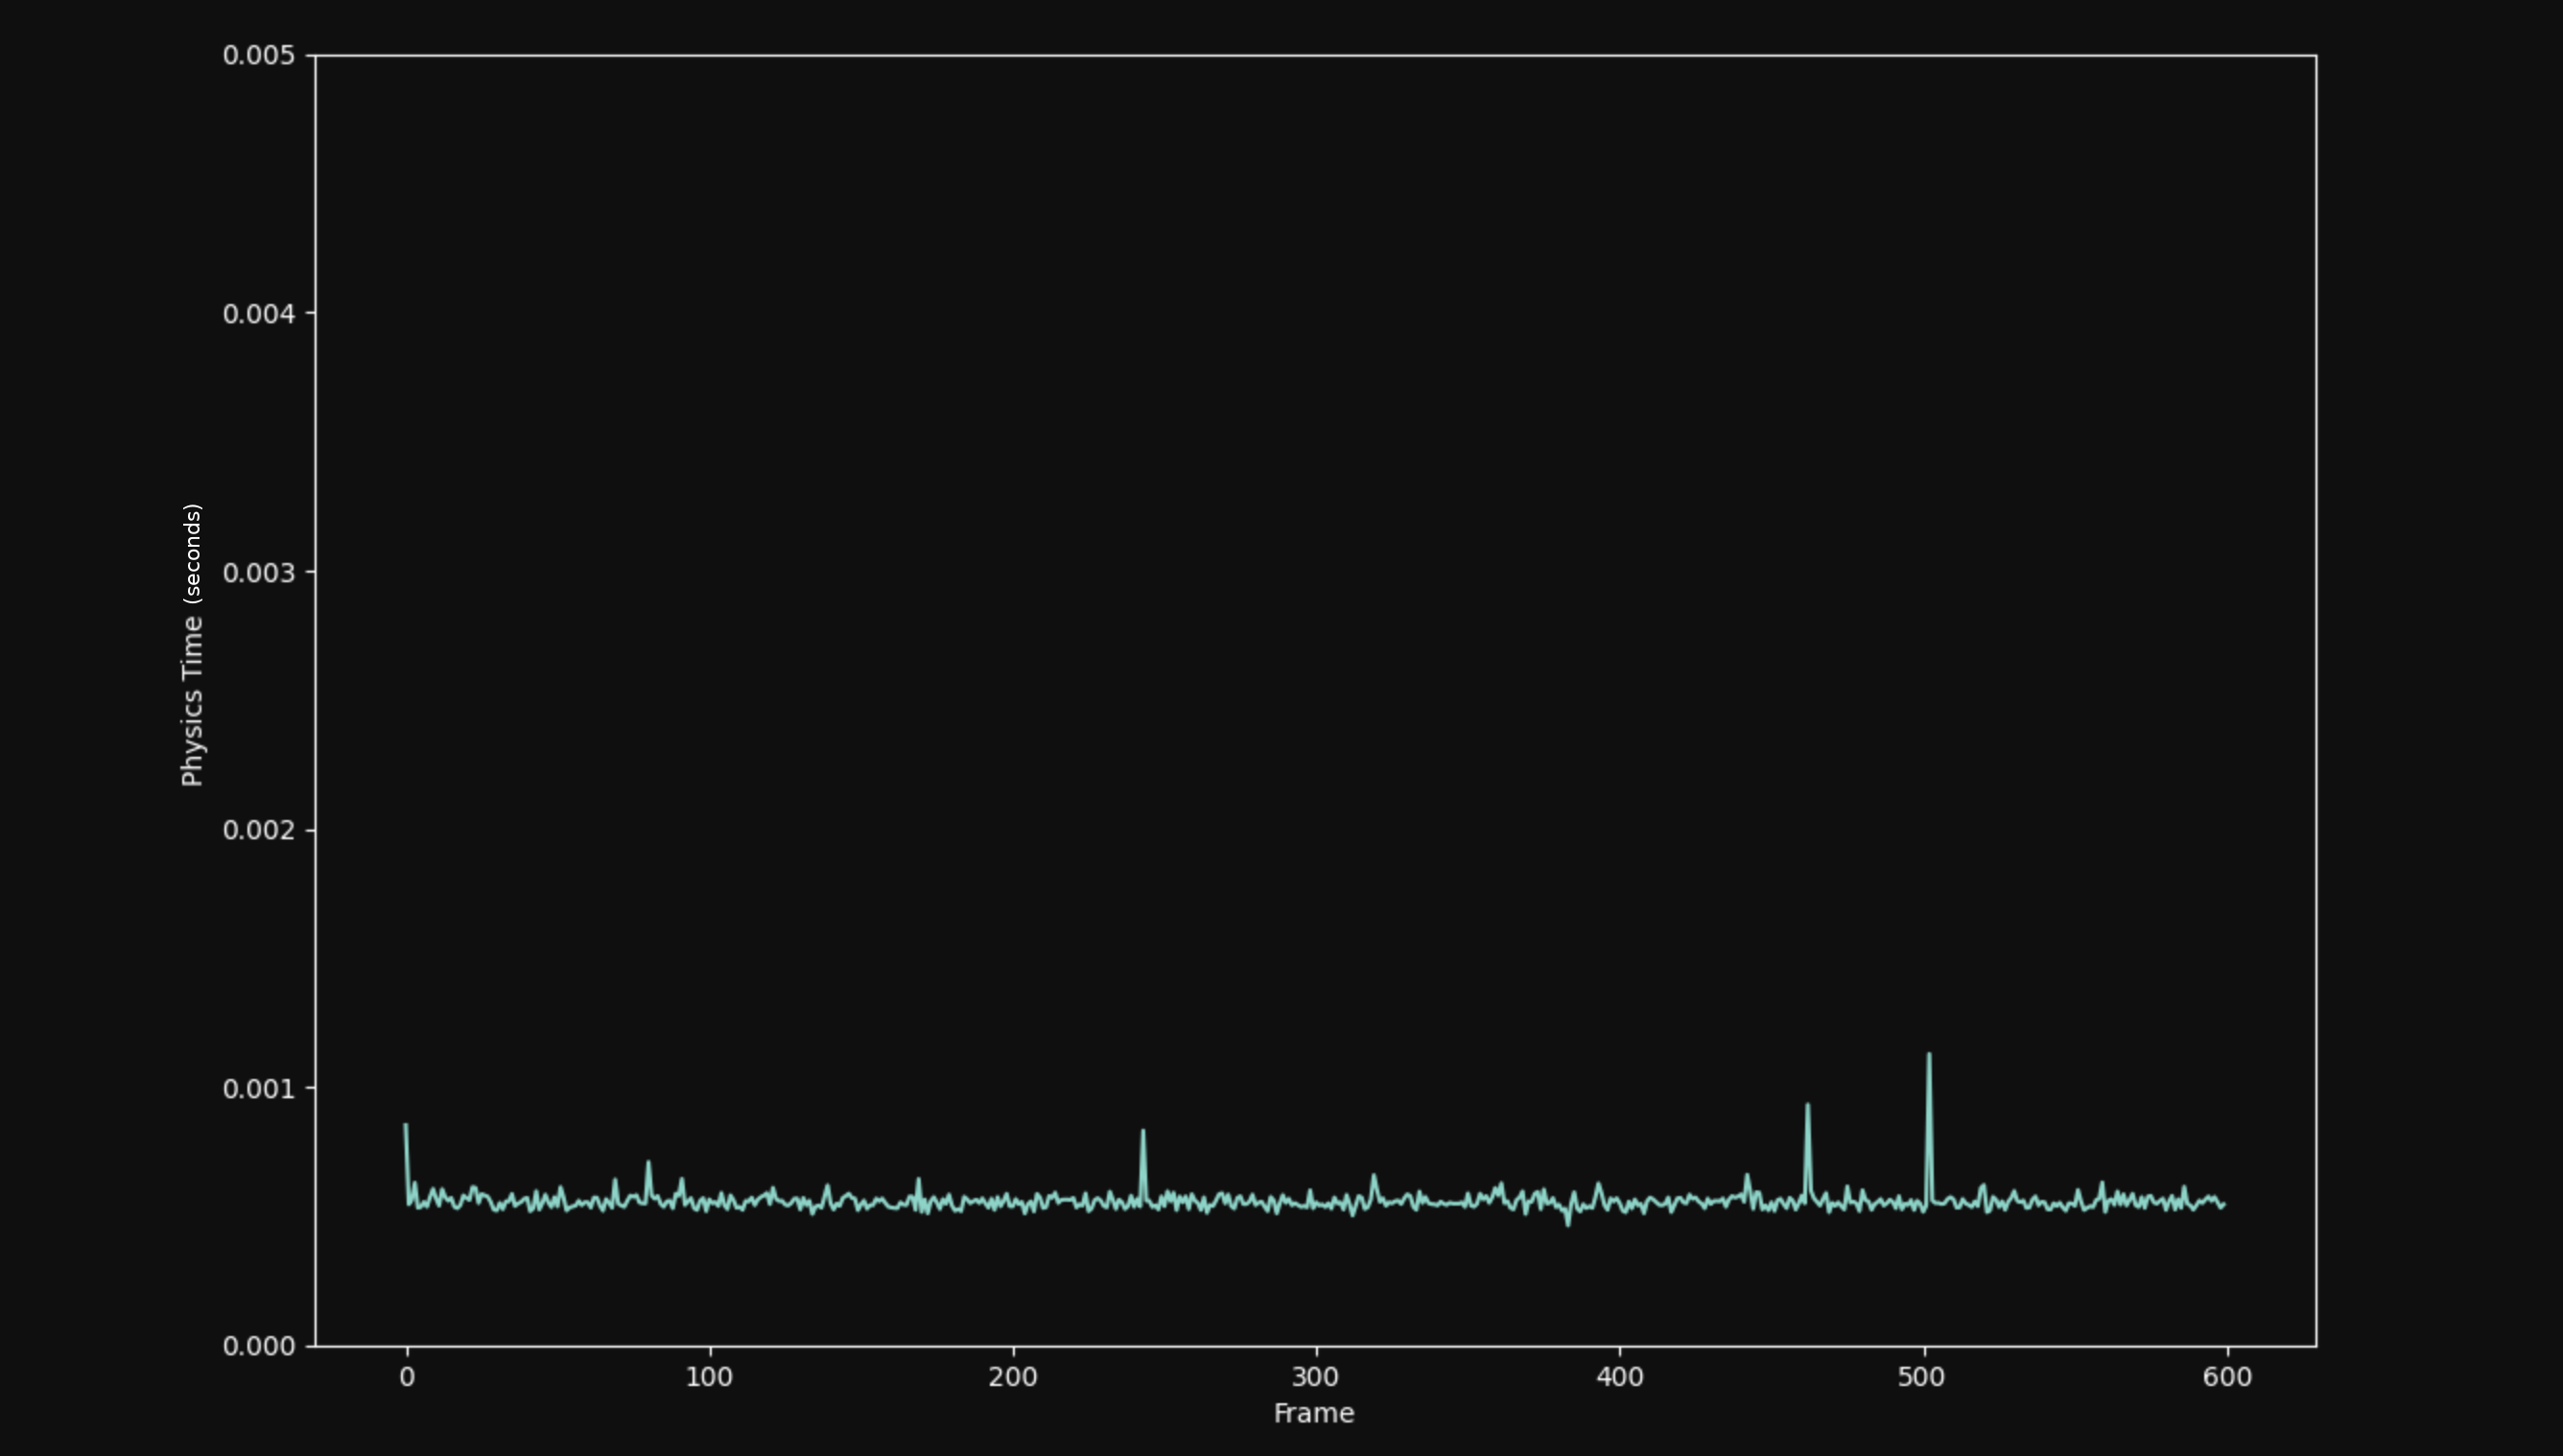
To verify this, I switched the governor to performance:
