Finding memory leaks in C++ with heaptrack
While scouring the internet for ways to track memory usage of processes, I found a lot of resources on valgrind(+massif). While valgrind is useful, it slows down your program significantly. This is particularly problematic when you have a memory leak that takes a long time to occur or balloon into a large amount. In my experience, heaptrack runs much faster1. Some approaches modify calls to new and delete. While this works perfectly well, it lacks visualizations.
Heaptrack is a memory profiler that provides a lot of useful information about memory hotspots and leaks in your code. Running it works best in debug mode binaries with DWARF information available. I’ve had good results running it in on executables compiled in Release+Debug Info mode. Run your executable with heaptrack as:
$ heaptrack ./executable [ARGS]
This generates a file like heaptrack.executable.9663.gz. This can be analyzed with:
$ heaptrack_gui heaptrack.executable.9663.gz
This gives, among many useful statistics, a flamegraph of memory leaks:
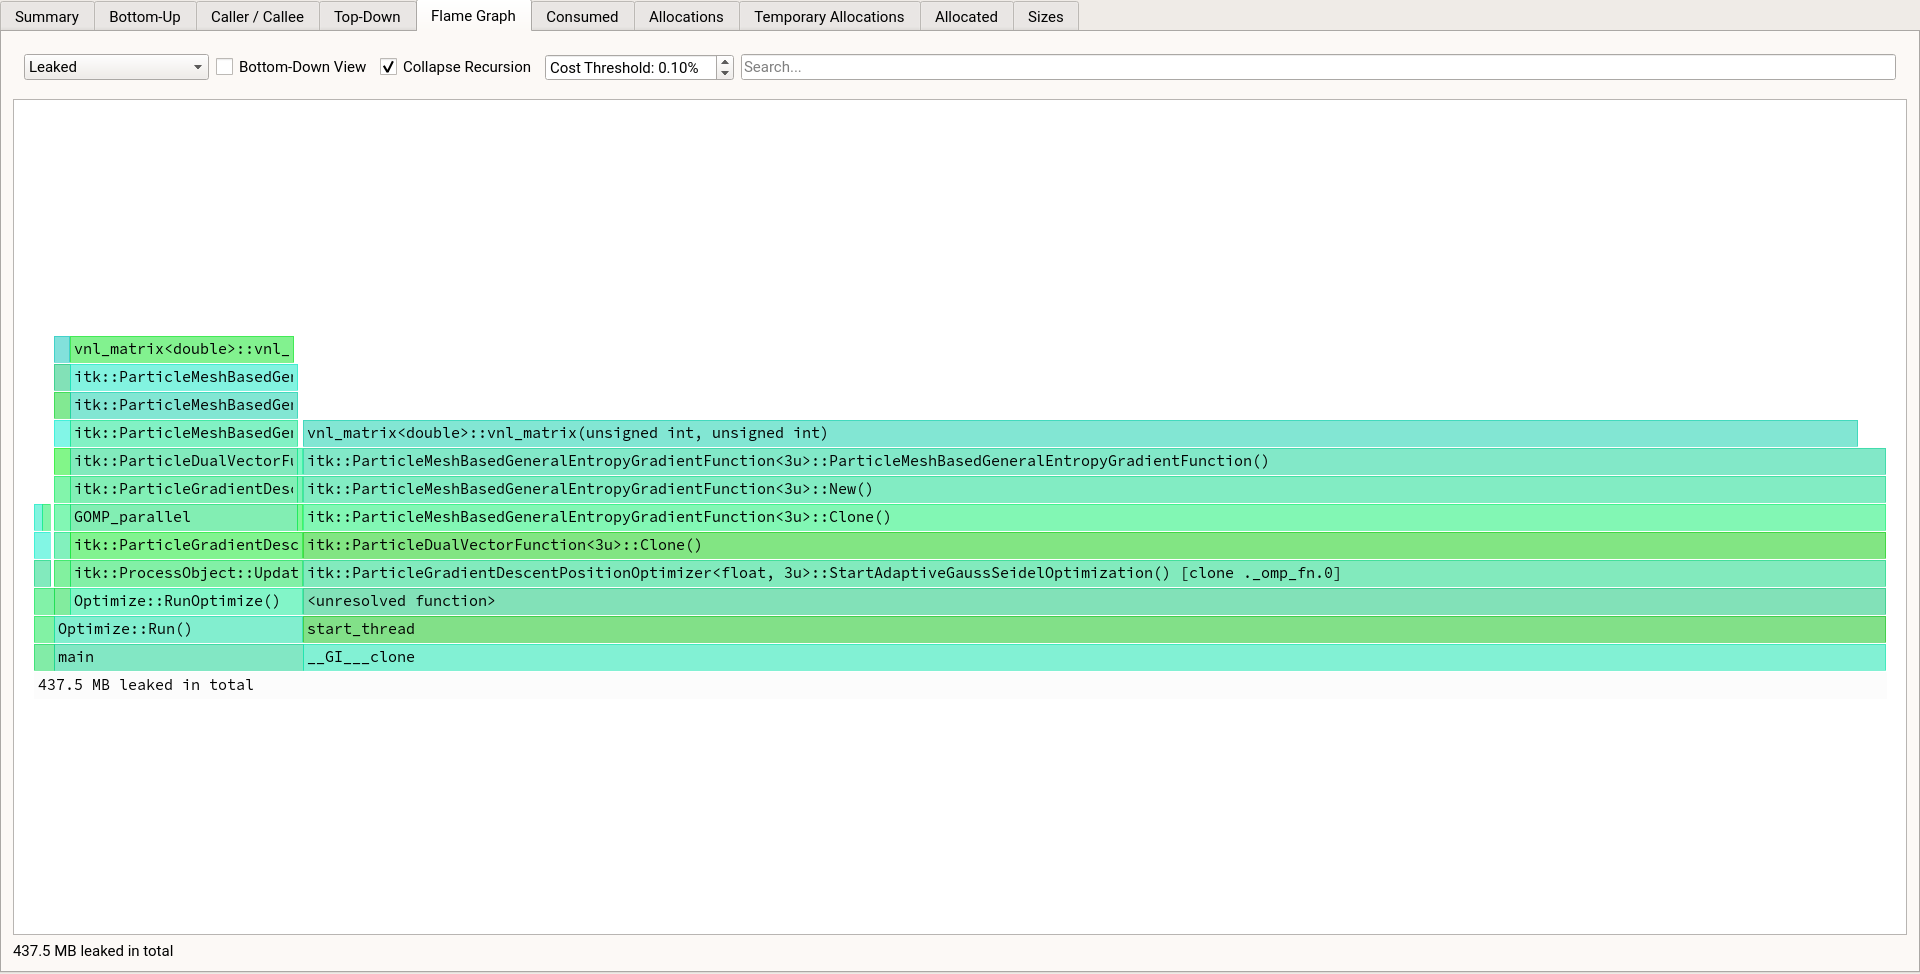
FlameGraph of leak
This makes it easy to plug the offending leak!
-
Milian Wolff has a great write-up on the design of heaptrack ↩︎